Bitcoin Demand Outpacing Miner Issuance To Unrivalled Degree
On-chain data shows that demand for Bitcoin from HODLers is currently outpacing miner issuance for the first time in history and by quite a lot.
Bitcoin Demand From Accumulation Addresses Is Higher Than Miner Issuance
As CryptoQuant head of research Julio Moreno explained in a new post on X, the demand for the asset has recently been growing at an unprecedented rate. Below is the chart shared by the analyst showing the demand from the “permanent holders.”
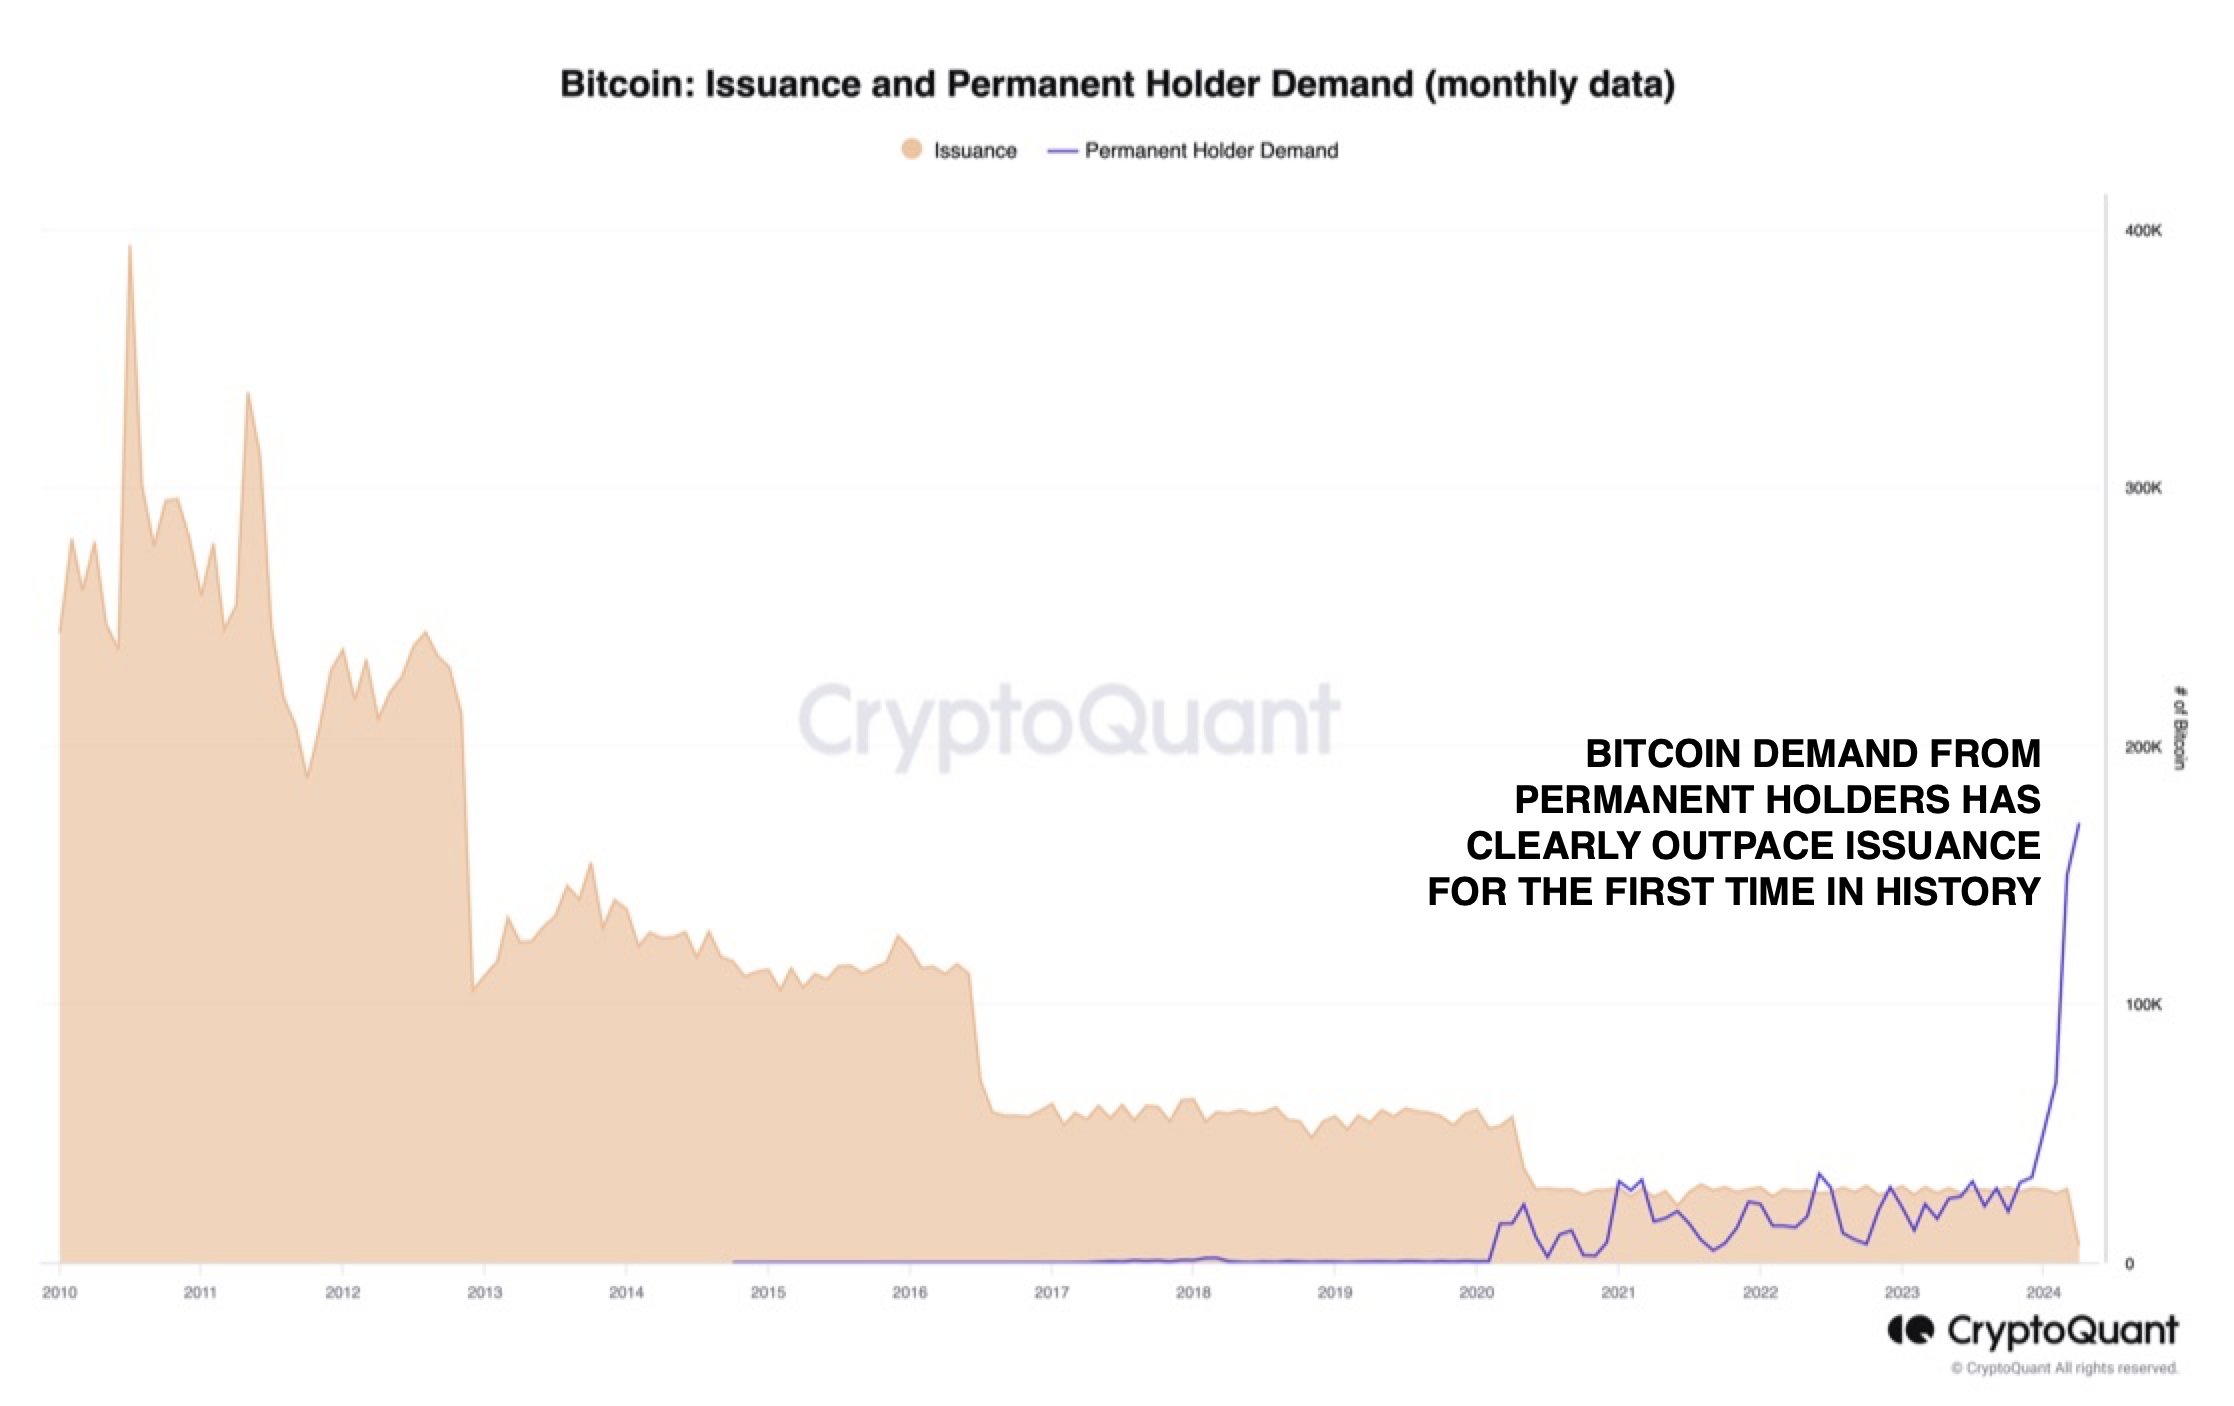
The BTC miner issuance and permanent holder demand, compared | Source: @jjcmoreno on X
The “permanent holders” here refer to the owners of the “accumulation addresses,” which are defined as wallets that have only a history of buying BTC and never of selling it.
Since these investors aren’t known to sell, it’s possible that the new supply that they accumulate would also become similarly illiquid in the future. As such, buying from these HODLers, in particular, can be a bullish sign, as it suggests the available trading supply of the asset is potentially going down.
In the chart, the demand from these HODLers is gauged using the growth in their combined balance. As is apparent, the accumulation addresses significantly upped their buying back in 2020 and maintained these growth levels for the next few years.
Moreno has also attached the Bitcoin “miner issuance” data to the same chart. This metric keeps track of the total amount of Bitcoin that the miners are minting on the network.
Miners “produce” BTC when they solve blocks and receive block rewards. These rewards are handed out in BTC and are the only way to increase the cryptocurrency’s circulating supply.
As the graph shows, the issuance observes streaks of a few years where it remains more or less constant. In between these streaks, its value suddenly plunges. The reason for this is naturally the halving.
The halving is a periodic event on the Bitcoin network where the block rewards are permanently slashed in half. These events occur roughly every four years; the next one is scheduled in about ten days.
As displayed in the chart, while the demand from the accumulation addresses was quite high starting in 2020, it never quite exceeded the issuance of the miners.
Recently, however, the growth in the accumulation addresses has exploded, with the metric not only sustaining above the network issuance but also far surpassing its value.
This implies that these HODLers are buying much more than the miners have produced on the network. The CryptoQuant head notes that this is naturally only a portion of the total demand of the network, as there are other buyer entities, so it shows just how strong the demand for BTC has been recently.
A major driver behind this demand would be the emergence of the Bitcoin spot exchange-traded funds (ETFs), which provide an alternative way to gain exposure to the cryptocurrency in a mode that’s preferable for traditional investors.
BTC Price
At the time of writing, Bitcoin is trading at around $68,400, up more than 4% over the past week.
Looks like the price of the asset has sharply gone down over the past day | Source: BTCUSD on TradingView
Featured image from Kanchanara on Unsplash.com, CryptoQuant.com, chart from TradingView.com
Disclaimer: The article is provided for educational purposes only. It does not represent the opinions of NewsBTC on whether to buy, sell or hold any investments and naturally investing carries risks. You are advised to conduct your own research before making any investment decisions. Use information provided on this website entirely at your own risk.
Source link