

Crypto analyst Jaydee recently highlighted a notable pattern on the XRP price chart ahead of its monthly close. The analyst hinted that this all but confirms that a parabolic move was on the horizon for the crypto token, going by what happened the last time this pattern formed.
Symmetrical Triangle Confirms The XRP Price Bullish Momentum
Jaydee noted in an X (formerly Twitter) post that a symmetrical triangle had formed on the XRP price chart. According to him, the last time this chart pattern formed, the MACD crossed above zero, which triggered a parabolic move in XRP’s price.
The price movement that he was referring to was the one that occurred in 2017 when the crypto token saw a 600x increase in its price.
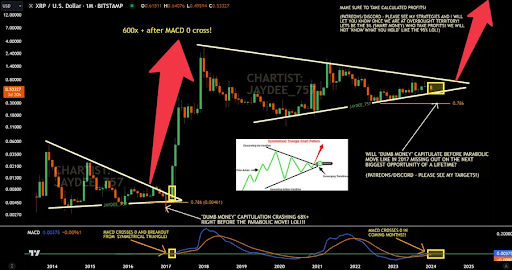
The crypto analyst was optimistic following this development as he stated that “2024 will be the year.” From the accompanying chart that he shared, one could see that Jaydee was expecting the MACD (Moving Average Convergence Divergence) to cross zero in the coming months.
Once that happens, the parabolic move is expected to follow, just like in 2017. Jaydee didn’t give any specific price level or how much gains XRP will see once this move to the upside occurs. However, crypto analyst Egrag Crypto has continued to provide insights into how high XRP could rise if this historical price movement is replicated.
In one of his previous XRP analyses, Egrag stated that XRP hitting $27 was a “plausible target” when this happens. In a more recent price prediction, he also alluded to the 2017 percentage while mentioning that XRP hitting $27 was still on the cards.
A Monthly Close Above $0.5 Is Expected
XRP is currently struggling to hold above the $0.50 support level. Despite that, Egrag doesn’t believe the XRP price will drop below that level before the month ends. He stated in an X post that XRP is “destined” to never close below $0.50 monthly. Meanwhile, any “downside wicking presents itself as a generational buying opportunity,” the crypto analyst claimed.
In another X post, Egrag provided insights into where XRP’s price may be headed from this current price level. The crypto analyst remarked that there was the “possibility of a wicking event to $0.41.” However, the good news is the “upcoming Wave 3,” which he referred to as the “exciting part.”
Egrag hinted that this Wave 3 will usher in the next short-term target, which is the new all-time high of $5. The analyst had before now boldly claimed that XRP would rise to $5 in the next 90 days, with this expected to happen sometime in April.
At the time of writing, the XRP price is trading at around $0.50, down over 5% in the last 24 hours, according to data from CoinMarketCap.
XRP trending at $0.5 | Source: XRPUSD on Tradingview.com
Featured image from The Block, chart from Tradingview.com
Disclaimer: The article is provided for educational purposes only. It does not represent the opinions of NewsBTC on whether to buy, sell or hold any investments and naturally investing carries risks. You are advised to conduct your own research before making any investment decisions. Use information provided on this website entirely at your own risk.
Source link