

CryptoQuant CEO has explained there is a delay between when Grayscale made Bitcoin outflows and when they made a disclosure.
Grayscale Has Made Some Bitcoin Outflows That Are Yet To Be Disclosed
A few days ago, CryptoQuant founder and CEO Ki Young Ju revealed a discrepancy between on-chain data and the off-chain disclosures made by the Grayscale Bitcoin Trust (GBTC).
Here are the charts that the analyst had shared in the X post:
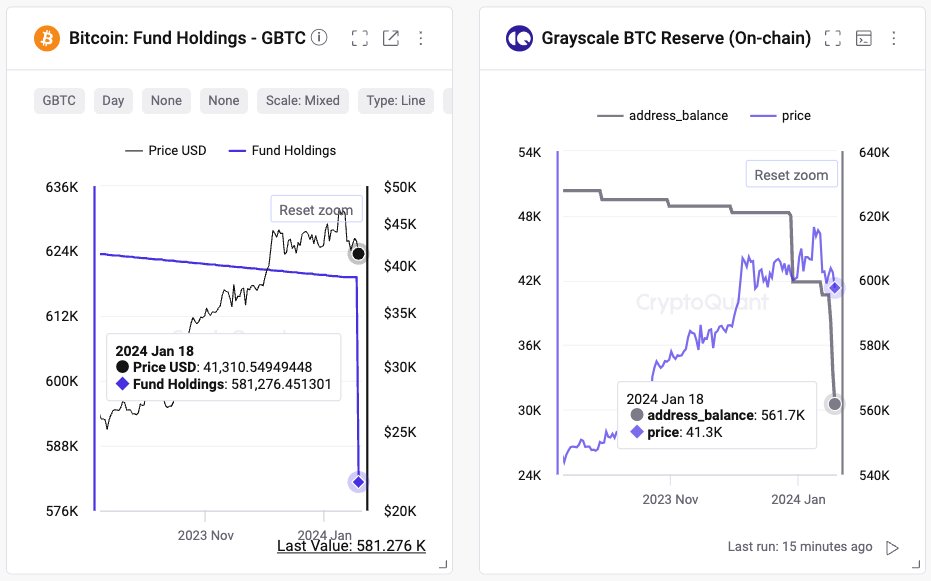
The on-chain and off-chain data of the GBTC funds | Source: @ki_young_ju on X
The left chart shows the data for the Bitcoin fund holdings of GBTC as disclosed by Grayscale, while the right one reveals the actual reserve of the ETF by tracking the on-chain addresses associated with it.
When Ju shared these charts, the left chart showed around 581,276 BTC in the GBTC reserve, while the right displayed about 561,700 BTC. The analyst had remarked that this meant a 19,500 BTC gap between the two holdings.
Today, the CryptoQuant CEO has shared an update on the two charts.
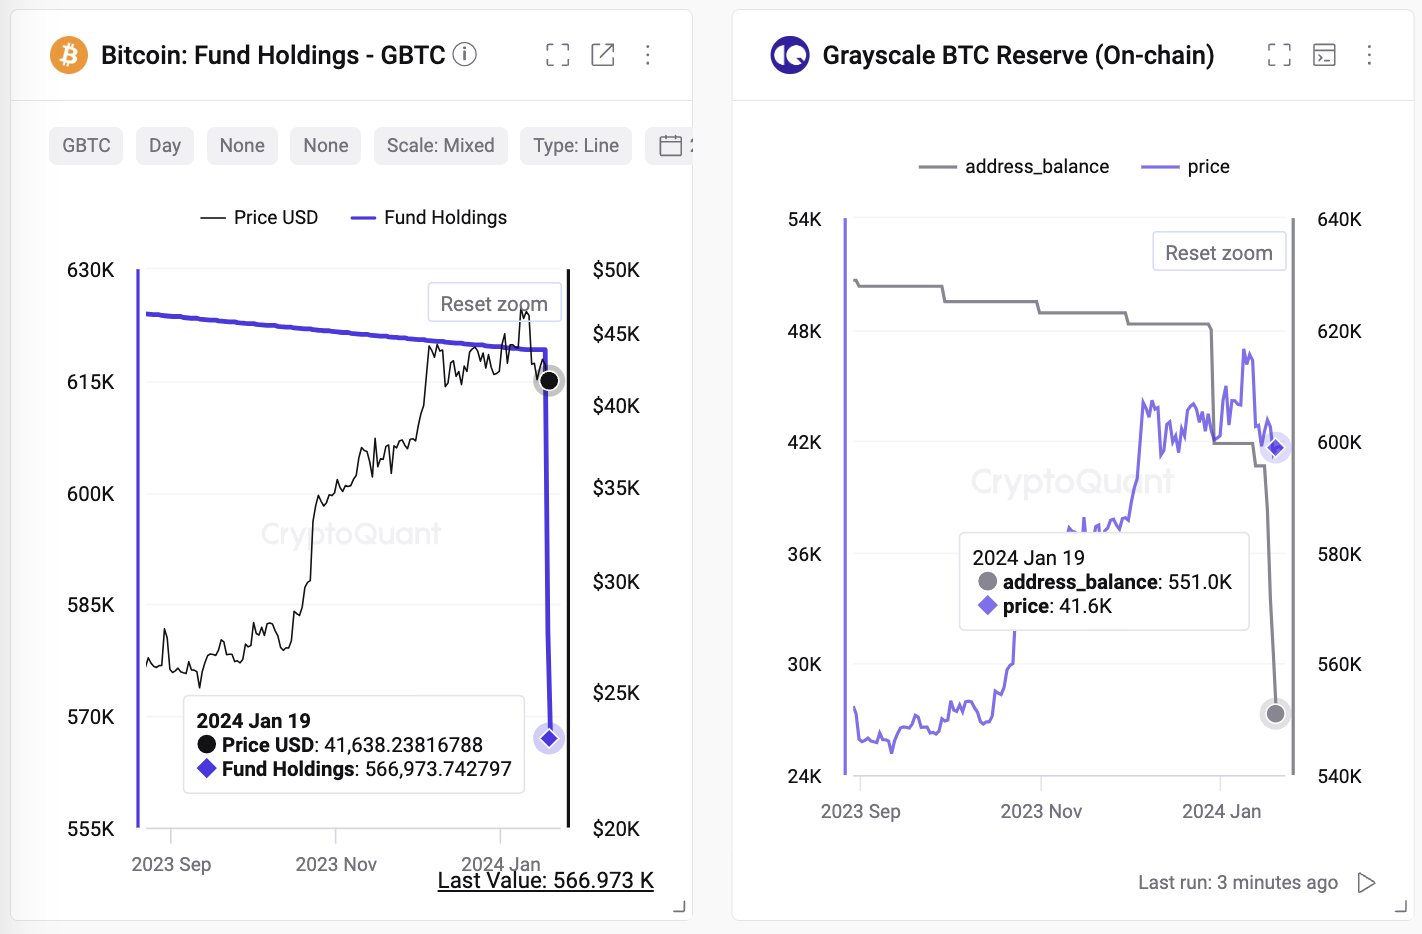
The latest data for the GBTC holdings | Source: @ki_young_ju on X
As on-chain data had already predicted, the disclosed holdings of the ETF did drop, although the plunge was actually to about 566,973 BTC, rather than the 561,700 BTC equal to the on-chain reserve.
It appears that GBTC has yet to disclose the full outflows, and from the chart, it’s also apparent that further outflows have even taken place from the on-chain reserve as its value has dropped further.
“Now, GBTC wallets’ balance is 551K, indicating they still have a gap of around 15K GBTC. We can anticipate more GBTC outflows in the books,” explains the CryptoQuant founder.
Old Tokens Of The Asset Have Been On The Move Recently
In another post on X today, Ju revealed that the Average Dormancy indicator has spiked for Bitcoin. The “Average Dormancy” here refers to a metric based on the “Coin Days Destroyed” (CDD) indicator.
The CDD keeps track of the coin days being destroyed throughout the Bitcoin network daily. A coin day here is a quantity that 1 BTC accumulates on the blockchain after staying still for 1 day.
When any token carrying some amount of such coin days is transferred on the blockchain, its coin days counter naturally resets back to zero, and the coin days are said to be “destroyed.”
The Average Dormancy is calculated as the CDD divided by the total number of coins involved in these dormancy-breaking transactions (this means that the Average Dormancy essentially measures the pure number of dormant days).
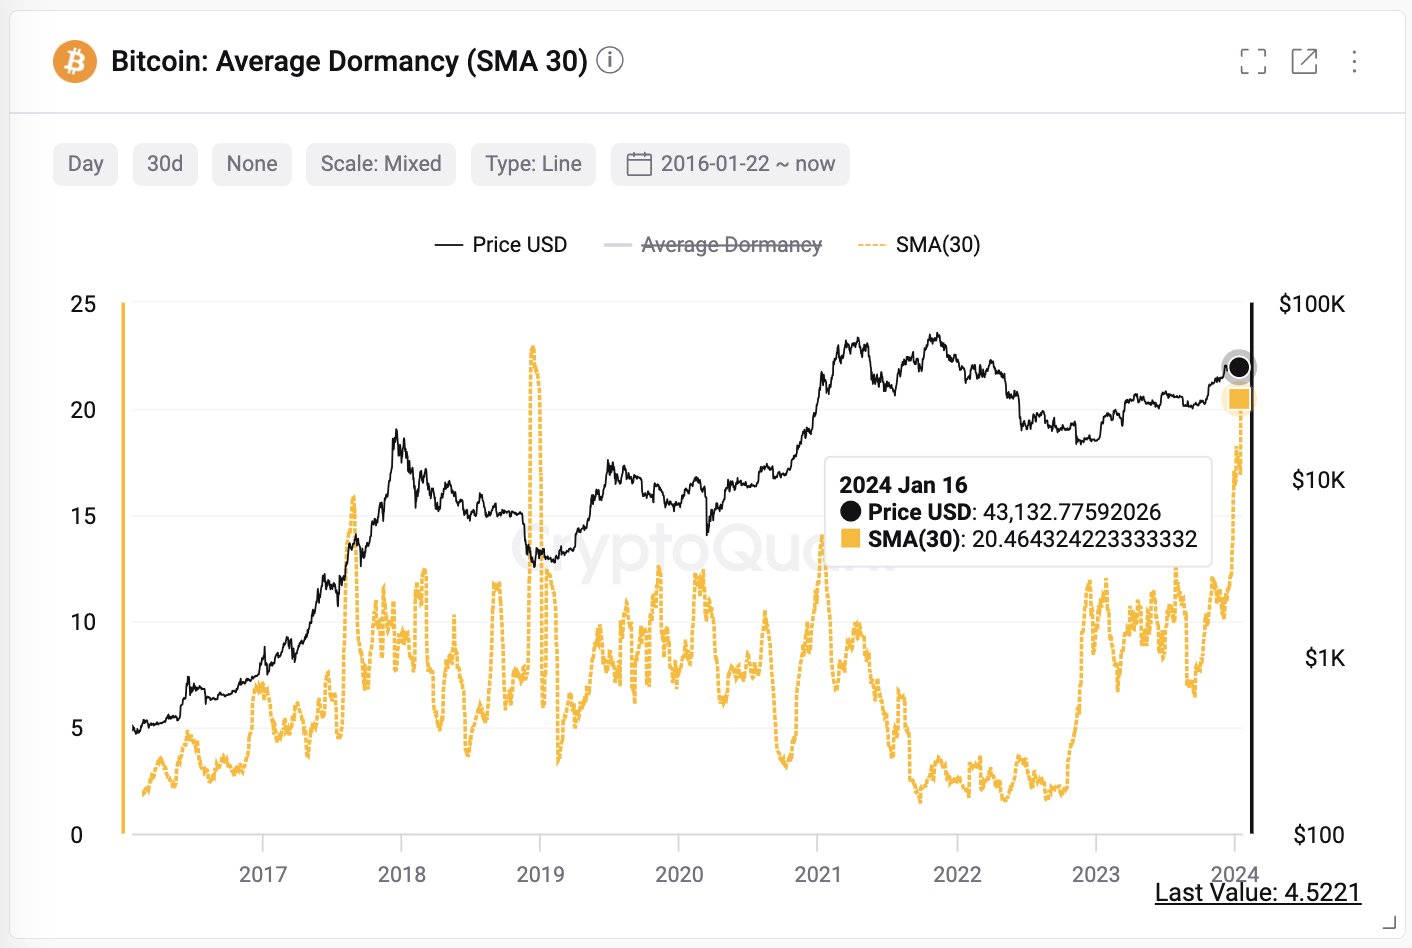
The value of the metric has shot up recently | Source: @ki_young_ju on X
The chart shows that the 30-day simple moving average (SMA) Average Dormancy hit a five-year high just recently, implying a huge amount of old coins have been transacted on the blockchain.
Was this spike in the metric due to the GBTC outflows? According to the CryptoQuant CEO, that’s unlikely to be the case. “The dates of their transactions don’t align closely with the spikes in CDD (Coins Days Destroyed),” says Ju.
At the time of writing, Bitcoin is floating around $40,500, down over 4% in the past week.
Looks like BTC has been struggling recently | Source: BTCUSD on TradingView
Featured image from iStock.com, charts from TradingView.com, CryptoQuant.com
Disclaimer: The article is provided for educational purposes only. It does not represent the opinions of NewsBTC on whether to buy, sell or hold any investments and naturally investing carries risks. You are advised to conduct your own research before making any investment decisions. Use information provided on this website entirely at your own risk.
Source link