
On-chain data shows the Bitcoin Supply in Profit has neared the 95% mark during the latest rally, which could signal a top for the asset.
Bitcoin Supply In Profit Has Surged To High Levels Recently
As explained by analyst James Van Straten in a new post on X, the Bitcoin Percent Supply in Profit has been approaching a territory that has historically led to tops for the coin.
The “Percent Supply in Profit” here refers to an on-chain indicator that keeps track of the total percentage of the Bitcoin supply carrying some unrealized gain.
The metric works by going through the blockchain history of each coin in circulation to see what price it was last transacted at. Assuming that this last transaction of the coin involved a change of hands, this previous price would be its current cost basis.
Thus, if this last transfer price for any coin were less than the cryptocurrency’s spot price, then that particular coin would be carrying a profit currently. The Percent Supply in Profit adds up all such coins and calculates what percentage of the supply they make up for.
A counterpart indicator, “Percent Supply in Loss,” keeps track of the coins of the opposite type. As the supply must add up to 100%, the Percent Supply in Loss is naturally just a hundred minus the Percent Supply in Profit.
Now, here is a chart that shows the trend in the Bitcoin Percent Supply in Profit over the last few years:
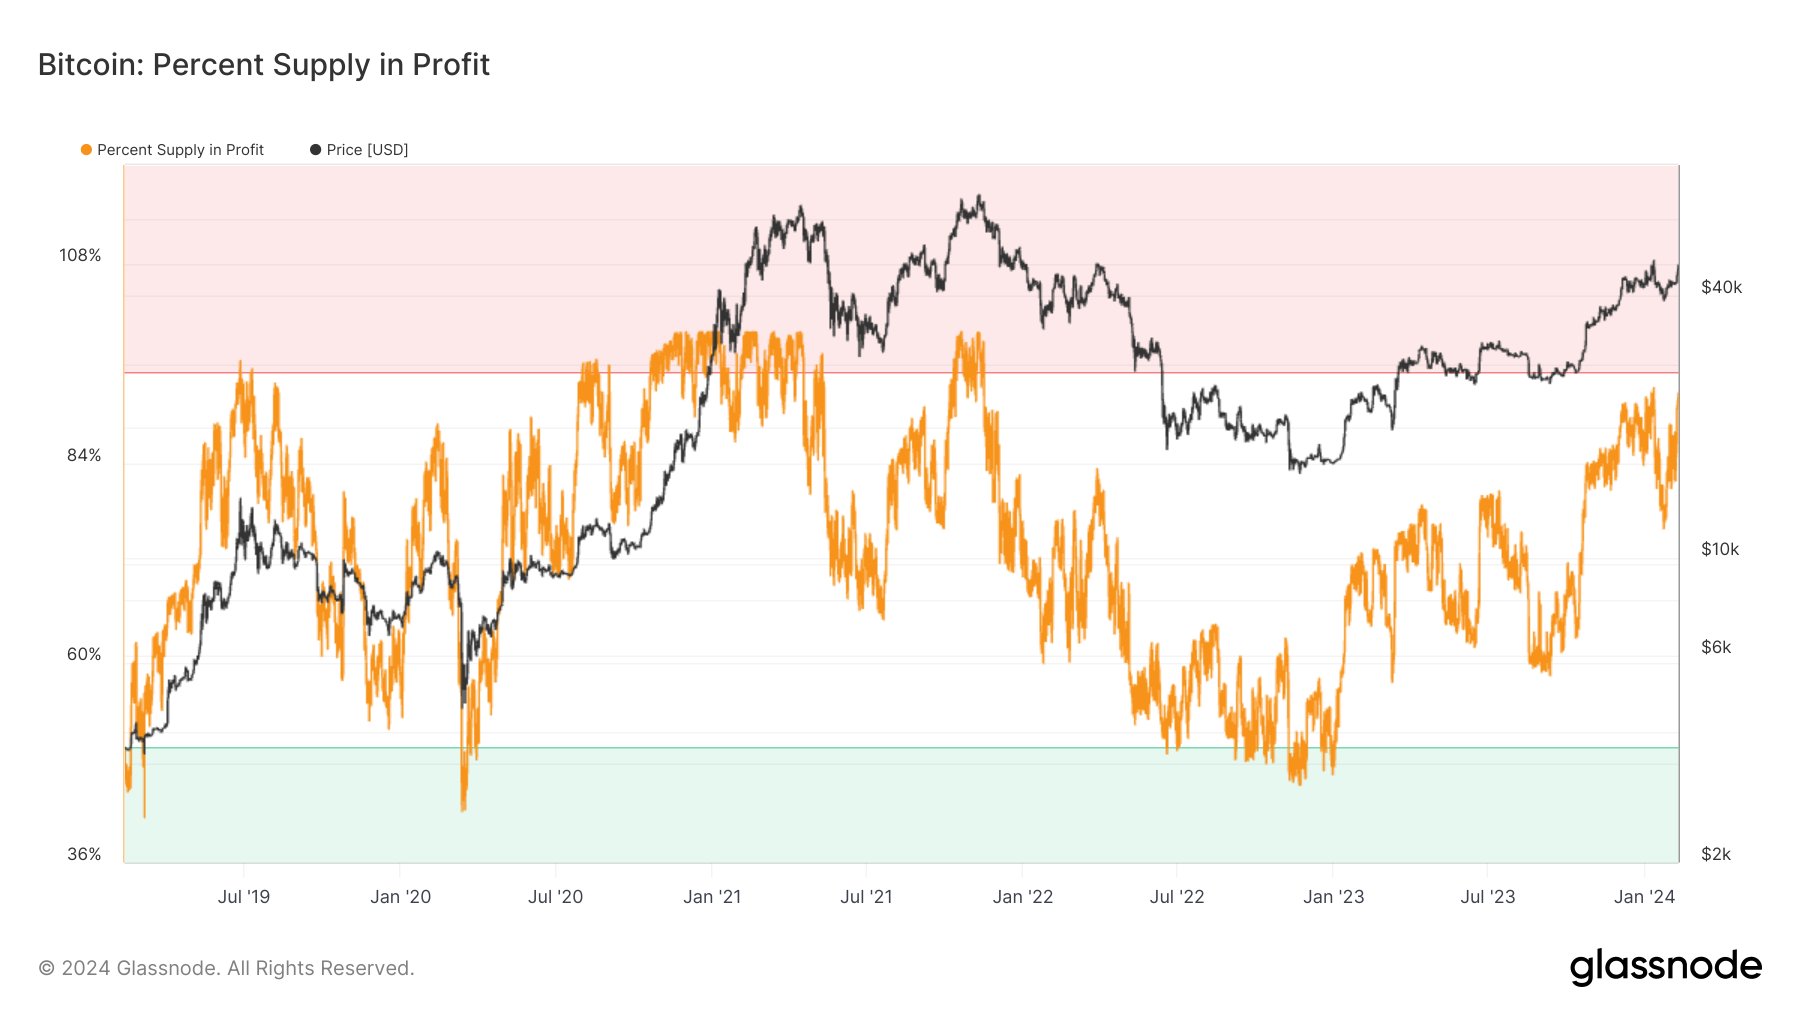
The value of the metric seems to have been sharply going up in recent days | Source: @jvs_btc on X
As the above graph shows, the Bitcoin Percent Supply In Profit has naturally shot up recently as BTC has observed its latest bullish push. Earlier during this rally, BTC had neared $49,000, but the coin has retraced toward the current price levels.
In the chart, the analyst has marked the two regions of the indicator that have historically been relevant for the cryptocurrency. In the red zone, at values greater than 95%, the asset has generally encountered tops.
This pattern is because profitable investors are more likely to sell their coins. As many holders make gains, the chances of a mass selloff increase.
Thus, it’s not surprising to see that the coin has been probable to form tops when an extreme portion of the supply has been in the green. The opposite is true for the region under 50%, where bottoms have occurred for the cryptocurrency.
At these levels, the majority of the supply is holding a loss, so there aren’t many profit sellers left in the market. This exhaustion of selling pressure helps the coin reach a point of turnaround.
The graph shows that the latest Percent Supply In Profit levels haven’t been far from the 95% cutoff of the top region. Considering these high levels, the coin may be on the verge of hitting at least a local top if one is not already in.
BTC Price
Since the surge earlier, Bitcoin has cooled off as it has retreated towards the $47,900 level.
Looks like the price of the coin has observed a sharp surge recently | Source: BTCUSD on TradingView
Featured image from iStock.com, charts from TradingView.com, Glassnode.com
Disclaimer: The article is provided for educational purposes only. It does not represent the opinions of NewsBTC on whether to buy, sell or hold any investments and naturally investing carries risks. You are advised to conduct your own research before making any investment decisions. Use information provided on this website entirely at your own risk.
Source link