

On Wednesday, ETH, the native coin of the Ethereum blockchain experienced a significant rejection at the resistance level of $2,871. Since this rejection, the price of Ethereum has gained a significant upward movement of over 9% and showing signs of even moving further.
At the time of writing, the price is still showing strong signs of moving upward toward the 100-day Simple Moving Average (SMA) and the trendline, both in the 4-hour and the 1-day timeframe. The price of ETH is currently trading around $3,116 and about 0.47% up in the last 24 hours.
A Further Look At The Ethereum Chart With The Following Technical Indicators
100-Day Moving Average and Trendline: As seen in the image below, although the price of ETH is currently moving toward the 100-day simple moving average and the trendline, it is still trading below these two indicators. This means at a certain point, the price of Ethereum could make a possible reversal and continue in its movement toward the downside.
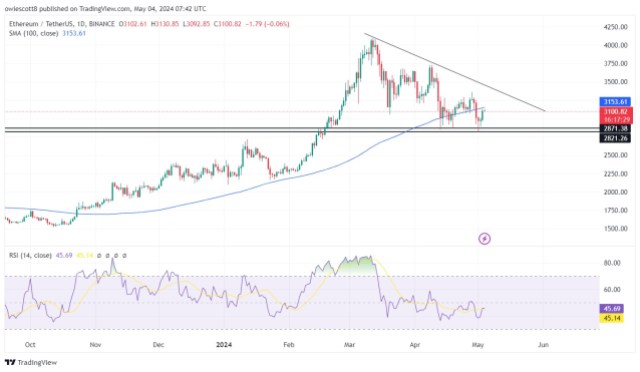
The RSI Indicator: Also observing the chart with the help of the Relative Strength Index Indication (RSI), it shows that the RSI signal line is trending above the 50 line which strongly indicates that the price might still move upward, as seen in the chart.
The 4-Hour MACD Indicator: After a close look at the MACD indicator in the 4-hour timeframe, it can be seen that the MACD histogram has moved above the zero line. Also, the MACD line and the signal line have crossed and are heading toward the zero line. This suggests there may be sustained upward price movement until a potential reversal.
Final Thought On ETH Movement
Based on Ethereum’s previous movement, there are two resistance levels of $3,250 and $3,355, and a support level of $2,819. As the price of Ethereum is moving upward, if it manages to break above the resistance level of $3,250, it might continue to move even further toward the $3,355 resistance level.
On the contrary, if Ethereum fails to break its previous resistance level, it might reserve and start a move downward toward its previous support level of $2,819. Should ETH succeed in breaching this level of support, it may descend even further to establish a new low.
Featured image from iStock, chart from Tradingview.com
Disclaimer: The article is provided for educational purposes only. It does not represent the opinions of NewsBTC on whether to buy, sell or hold any investments and naturally investing carries risks. You are advised to conduct your own research before making any investment decisions. Use information provided on this website entirely at your own risk.
Source link