

Data shows the Bitcoin Coinbase Premium Index has turned negative once more, a sign that could prove to be bearish for the asset’s price.
Bitcoin Coinbase Premium Index Has Dipped Into Red Territory
As pointed out by an analyst in a post on X, selling pressure on Coinbase has risen recently. The indicator of interest here is the “Coinbase Premium Index,” which measures the percentage difference between the Bitcoin prices listed on cryptocurrency exchanges Coinbase and Binance.
When the value of this metric is positive, it means that the price listed on Coinbase is greater than that on Binance right now. Such a trend implies either the buying pressure on the former is higher than the latter or the selling pressure is lower.
On the other hand, a negative value implies Coinbase may be witnessing a higher amount of selling pressure currently, as the price listed here is lower than on Binance.
Now, here is a chart that shows the trend in the Bitcoin Coinbase Premium Index over the last few months:
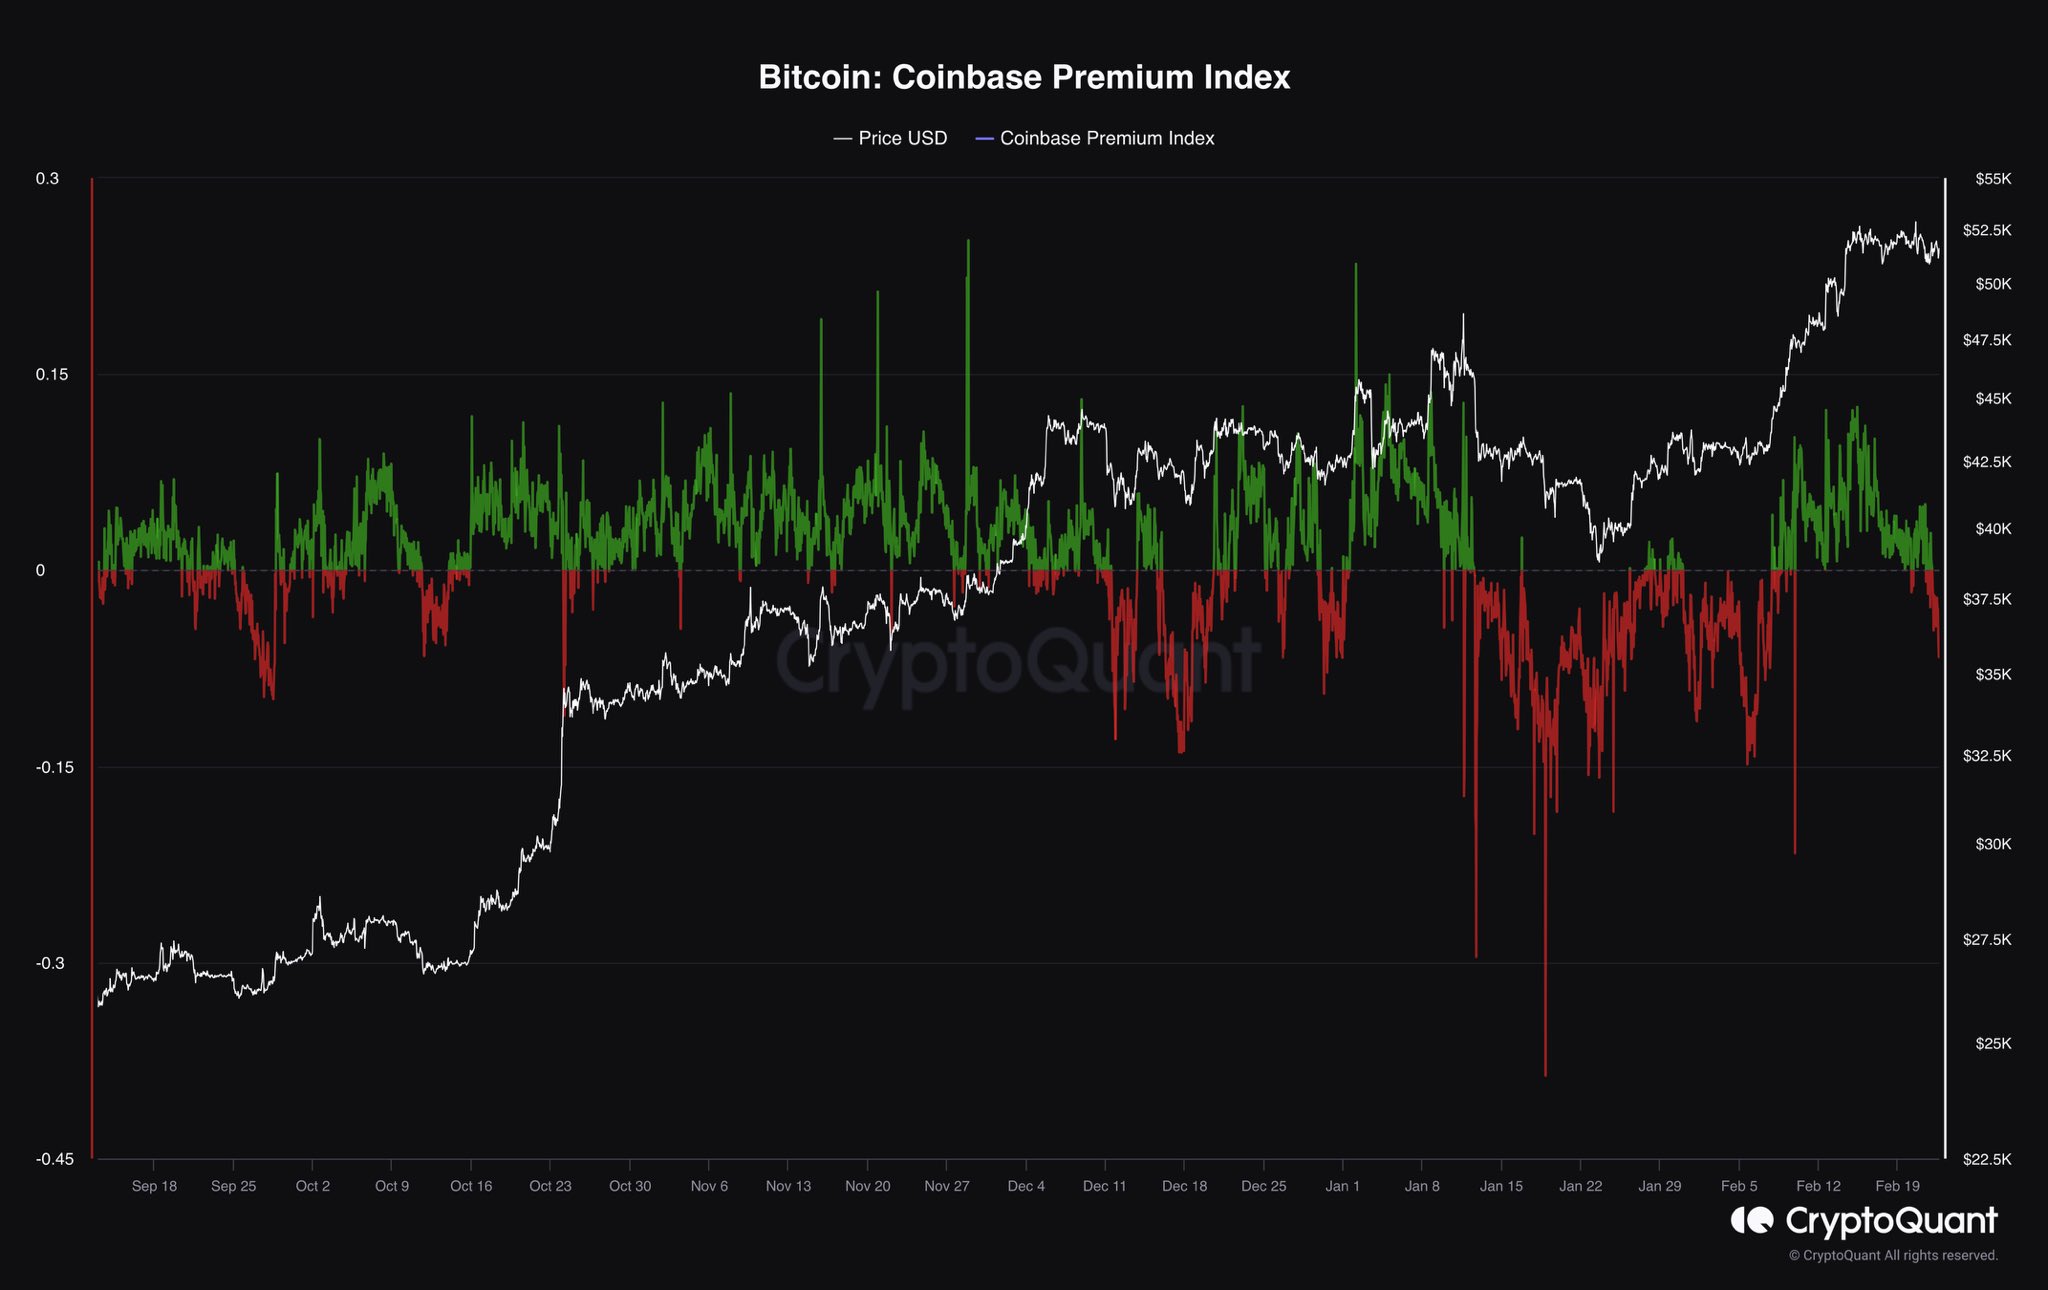
The value of the metric appears to have just turned red | Source: @IT_Tech_PL on X
As displayed in the above graph, the Bitcoin Coinbase Premium Index had been notably positive earlier, and alongside these high values, the cryptocurrency’s price had rallied up.
This would imply that the relatively high buying pressure on the platform may have contributed to the coin’s surge. Once the indicator had cooled to low (but still positive) values, the price slumped to a sideways movement.
The Coinbase Premium Index has recently taken to outright negative values, implying that sellers have potentially appeared on the exchange. The last time the indicator turned red was during the spot ETF sell-the-news event, which didn’t end well for the coin.
Coinbase is popularly known to be used by the US-based institutional investors, so the Premium Index can tell us about how the behavior of these large entities differs from that of Binance’s global userbase.
The latest rally was driven by buying from institutional entities like ETFs, which is why the metric had been positive. But it would appear that buying pressure from these investors has now run out as sellers have leaped ahead.
If past precedent is anything to go by, this dip into the negative territory might mean that Bitcoin would at least continue to consolidate, if not outright register a drawdown.
However, a bearish outcome may be averted if the Coinbase Premium Index switches back into positive territory in the coming days. It remains to be seen if this selling pressure from the American whales is the start of a new trend or if it’s only temporary.
BTC Price
At the time of writing, Bitcoin is trading around the $50,900 mark, down 2% in the past week.
Looks like the price of the coin has been moving sideways in the last few days | Source: BTCUSD on TradingView
Featured image from Shutterstock.com, CryptoQuant.com, chart from TradingView.com
Disclaimer: The article is provided for educational purposes only. It does not represent the opinions of NewsBTC on whether to buy, sell or hold any investments and naturally investing carries risks. You are advised to conduct your own research before making any investment decisions. Use information provided on this website entirely at your own risk.
Source link